Everyone talks about what Claude Code does. Nobody explains how. I spent days reverse-engineering the internals by analyzing real session data, and what I discovered changed how I think about AI-assisted development.
This post is for engineers who want to understand the internal mechanics — not the marketing pitch. We'll look at real JSONL files, real token counts, and real cost breakdowns from 4 days of heavy Claude Code usage across multiple projects.
Architecture Overview
AI-assisted coding requires solving a fundamental tension: the AI model runs in the cloud, but your code lives on your machine. Claude Code's architecture resolves this cleanly:
Developer Terminal
       ↕
   stdin/stdout
       ↕
  Node.js CLI (Local) ——— File I/O, Shell ———→ Local Filesystem
       ↕
   HTTPS / SSE
       ↕
  Anthropic API (Cloud)
       ↕
   Inference
       ↕
   GPU Cluster
The key insight: Claude Code is a local Node.js CLI that acts as an orchestration layer between you and Anthropic's API. The AI proposes actions (read file, edit code, run command), and the CLI executes them locally in a security sandbox.
One important thing to understand: the GitHub repo contains the full source code — Claude Code was open-sourced in 2025. What we can analyze beyond the code itself is the session data it produces — and that's exactly what I did.
Session Storage & Folder Structure
Claude Code stores every conversation as append-only JSONL files in your local filesystem. There are two default locations:
~/.claude/projects/— the old default~/.config/claude/projects/— the new default (after a breaking change in Claude Code)
Path Encoding
Your project directory gets encoded into the folder name by replacing / with -:
/Users/john/Desktop/projects/saas-platform
→ -Users-john-Desktop-projects-saas-platform
Real Directory Structure
Here's what a real project with multiple sessions looks like:
~/.claude/projects/-Users-john-Desktop-projects-saas-platform/
├── 1888752c-cd02-48f6-848e-ccf8567e690f.jsonl     ← Session 1 (8.9 MB, 4,260 lines)
│   └── subagents/
│       ├── agent-a62021154333096fe.jsonl            ← Explore agent (Haiku)
│       ├── agent-a70c323807aca87dd.jsonl            ← Explore agent (Haiku)
│       ├── agent-acompact-295a86e6a5d3ef66.jsonl   ← Compact agent (Sonnet)
│       └── ... (17 subagent files total)
├── 2fed1aa9-0d0a-48f3-8f96-a9715076752a.jsonl     ← Session 2 (3.5 MB)
└── 5dbbdf47-81b5-46a6-a203-ca95a41fae19.jsonl     ← Session 3 (4.4 MB)
Each session file is named with its UUID session ID. Subagent files live in a subagents/ subdirectory under each session.
Why Append-Only JSONL?
The design choice of append-only JSONL is deliberate:
- Crash-safe — partial writes don't corrupt earlier data
- Streamable — you can tail the file in real-time
- Easy to parse — one JSON object per line, no complex structure
- Natural audit log — every event is preserved in order
JSONL Session Format — The 6 Record Types
Every line in a session JSONL file has a type field. After analyzing thousands of lines across multiple sessions, I identified exactly 6 record types:
1. file-history-snapshot
Saves file state before edits, enabling undo. Appears at the start of each user turn.
2. user
Your messages to Claude. Contains metadata like sessionId, cwd (current working directory), version (Claude Code version), and gitBranch. No token data.
3. system
System prompt injections — this is where CLAUDE.md content, tool definitions, and other context gets recorded. No token data.
4. progress
Streaming chunks during response generation. These are the incremental updates that make Claude's response appear word-by-word in your terminal. A single response generates 50-100+ progress records. No token data.
5. assistant
The final response record. This is the only record type that contains message.usage with token data. This is the goldmine.
{
  "type": "assistant",
  "message": {
    "model": "claude-sonnet-4-20250514",
    "usage": {
      "input_tokens": 3,
      "output_tokens": 169,
      "cache_creation_input_tokens": 716,
      "cache_read_input_tokens": 26894
    }
  },
  "costUSD": 0.00
}
Note: The costUSD field was removed after Claude Code v1.0.9 (June 2025) — it now always reads $0.00. You have to calculate costs from token counts yourself.
6. queue-operation
Task queue management for background tasks. Minimal data, used internally by the CLI.
Line Distribution in a Real Session
Here's the breakdown from one of my research sessions (408 lines total):
| Record Type | Count | % of Lines |
|---|---|---|
progress | 364 | 89.2% |
assistant | 24 | 5.9% |
user | 16 | 3.9% |
file-history-snapshot | 4 | 1.0% |
system | 2 | 0.5% |
The takeaway: ~90% of JSONL lines are streaming progress records with no token data. Only the assistant records matter for usage analysis.
The 4 Token Types — Anatomy of a Response
Every assistant record contains exactly 4 token counts. Understanding what each one means is critical:
Real Data: 4-Day Breakdown (165.9M tokens)
| Token Type | Count | % of Total | What It Is |
|---|---|---|---|
cache_read_input_tokens | 161,299,000 | 97.2% | Context retrieved from GPU cache |
cache_creation_input_tokens | 4,246,253 | 2.6% | Context computed for first time |
output_tokens | 328,428 | 0.2% | Claude's generated response |
input_tokens | 64,852 | 0.04% | Actual new prompt content |
| Total | 165,938,533 | 100% |
Read that again: 97.2% of all tokens are cache reads. Your actual "new" content — the thing you typed plus Claude's response — is just 0.24% of total tokens.
The Hidden Sub-Object
Inside the assistant record, there's a nested cache_creation object that reveals which cache tier was used:
"cache_creation": {
    "ephemeral_1h_input_tokens": 690262,
    "ephemeral_5m_input_tokens": 0
}
From my analysis: 100% of cache creation tokens use the 1-hour cache tier. Zero tokens used the 5-minute tier. This has significant cost implications (more on this later).
Request Lifecycle — What Happens When You Send One Message
Let's trace exactly what happens when you type a message, using real data from my sessions.
Step-by-Step
-
You type a message in the terminal (say: "Fix the auth bug")
-
CLI assembles the full prompt (~33,000 tokens):
- System prompt: ~10,000 tokens
- Tool definitions: ~8,000 tokens
- CLAUDE.md files: ~5,000 tokens
- Full conversation history: ~10,000+ tokens
- Your new message: ~20 tokens
-
CLI marks the reusable prefix with
cache_control: { type: "ephemeral" }so the API knows what can be cached -
Full payload sent to Anthropic API via HTTPS
-
API checks KV cache for matching prefix → cache hit on 97%+ of tokens
-
GPU computes only new tokens (your message + response)
-
Response streams back (generating 50-100+
progressrecords in JSONL) -
If response contains
tool_use(e.g., "Read file X") → CLI executes locally → result sent back → another API call -
Loop repeats until Claude responds with text only (no more tool calls)
-
Final
assistantrecord written to JSONL with complete usage data
The Tool Use Loop
User Message
    ↓
Assemble Prompt (~33K tokens)
    ↓
Send to Anthropic API
    ↓
┌── Response Type? ──┐
│                    │
↓ tool_use           ↓ text only
Execute Locally      Display Response
│                    │
↓                    ↓
Send Result ────→    Write to JSONL
(back to API)
Real Example: One Message = Multiple API Calls
When I typed "we need to deploy this buddy," it triggered:
| API Call | Action | Cache Read | Cache Create | Output |
|---|---|---|---|---|
| 1 | Read deployment config | 22,714 | 13 | 487 |
| 2 | Edit Dockerfile | 22,714 | 13 | 1,203 |
| 3 | Run build command | 22,714 | 13 | 892 |
| 4 | Final response | 22,714 | 13 | 3,036 |
1 message → 4 API calls → 229,017 total tokens
Notice how cache_read is identical across all 4 calls — the same conversation prefix is reused every time.
The Caching Mechanism — Engineering Deep Dive
This is where Claude Code's engineering really shines. Understanding the caching system explains why the product economics work.
What is KV Cache?
When a transformer model processes text, each layer computes Key and Value matrices from the attention mechanism. These matrices represent the model's "understanding" of the input at each layer. Computing them is the most expensive part of inference.
KV Cache stores these pre-computed matrices in GPU RAM so they don't need to be recomputed when the same prefix appears again.
How Prefix Caching Works
Turn 1:  [System Prompt + Tools + CLAUDE.md + Message 1]
          ^^^^^^^^^^^^^^^^^^^^^^^^^^^^^^^^^^^^^^^^^^^^^^^^
          ALL computed fresh → stored in GPU cache

Turn 2:  [System Prompt + Tools + CLAUDE.md + Message 1 + Response 1 + Message 2]
          ^^^^^^^^^^^^^^^^^^^^^^^^^^^^^^^^^^^^^^^^^^^^^^^^^^^^^^^^^^
          Retrieved from cache (FREE)                                ^^^^^^^^^^^
                                                                     Computed fresh

Turn 10: [System Prompt + Tools + CLAUDE.md + Msg1 + R1 + ... + Msg10]
          ^^^^^^^^^^^^^^^^^^^^^^^^^^^^^^^^^^^^^^^^^^^^^^^^^^^^^^^^^^^^^
          99.9% from cache (FREE)                                    ^^
                                                                     0.1% new
The Math
Without cache:
- 27,000 token prefix × 27,000 attention calculations = 729,000,000 computations
With cache:
- 3 new tokens × 27,000 = 81,000 computations
That's ~9,000x less compute. This is why Anthropic can offer flat-rate pricing on Pro and Max plans.
Cache Growth Timeline (Real Data)
| Turn | Cached | New Compute |
|---|---|---|
| Turn 1 | 0% | 100% (fresh compute) |
| Turn 2 | 95% | 5% |
| Turn 5 | 98.5% | 1.5% |
| Turn 10 | 99.9% | 0.1% |
Cache Tiers and Pricing
| Tier | Duration | Write Cost | Read Cost |
|---|---|---|---|
| 5-minute ephemeral | 5 min | 1.25× input price | 0.1× input price |
| 1-hour ephemeral | 1 hour | 2× input price | 0.1× input price |
Key finding from my analysis: Claude Code exclusively uses the 1-hour cache tier. Every single ephemeral_5m_input_tokens value was 0. This means cache writes cost 2× the input token price — but reads (97% of tokens) cost only 10%.
Tiered Pricing Above 200K Tokens
Anthropic applies different rates when context exceeds 200K tokens. This is another invisible detail the CLI handles for you.
Subagents & Multi-Model Routing
Claude Code doesn't use one model for everything. It runs a multi-model architecture that routes tasks to the cheapest capable model.
Model Routing Strategy
| Task Type | Model | Cost per MTok (Input) |
|---|---|---|
| Complex reasoning, code generation | Opus 4.6 | $15.00 |
| Standard coding, editing | Sonnet 4.6 | $3.00 |
| Research, file exploration, code search | Haiku 4.5 | $0.80 |
| Context compression | Sonnet 4.6 | $3.00 |
Agent Types Discovered
From analyzing subagent files, I found these agent types:
Explore— Uses Haiku for fast codebase search and file explorationgeneral-purpose— Uses Sonnet/Opus for complex multi-step tasksPlan— Uses Sonnet for implementation planning- Compact agents — Uses Sonnet to compress conversation context
Real Data: SaaS Platform Session
My largest session (SaaS Platform project) tells the story:
- 1,070 turns across the main conversation
- 271 subagents spawned automatically
- Each subagent gets its own JSONL file in
subagents/ - 793 duplicate records correctly filtered via deduplication
The Deduplication Challenge
When a subagent runs, its responses are logged in both the parent session file AND the subagent's own agent-*.jsonl file. Without deduplication, you'd double-count tokens and costs.
The dedup mechanism uses a composite key: messageId:requestId. Any record with the same composite key is counted only once.
From my research session:
- 210 raw Haiku entries in JSONL files
- 137 duplicates (same message in both parent + subagent file)
- 73 unique entries after dedup
This multi-model routing is completely invisible to you as a developer. You don't configure it. The CLI decides when to spawn a cheap Haiku agent for research vs. using Opus for complex reasoning.
Subagent Architecture
Main Session (Opus/Sonnet)
├── Explore Agent (Haiku)     → subagents/agent-a620.jsonl
├── Explore Agent (Haiku)     → subagents/agent-a70c.jsonl
├── General Purpose (Sonnet)  → subagents/agent-a186.jsonl
└── Compact Agent (Sonnet)    → subagents/agent-acompact-295a.jsonl
Context Compression (Compaction)
What happens when your conversation gets too long? Claude Code has an elegant solution.
How It Works
When context approaches ~200K tokens, the CLI auto-triggers a compact agent that:
- Takes the entire conversation history
- Summarizes it into ~5K tokens, preserving key context
- Replaces the old history with the summary
- Continues the conversation with a fresh, smaller context
This is observable in JSONL as system messages containing summary content, and as agent-acompact-*.jsonl files in the subagents directory.
Trade-offs
- Benefit: Sessions can run indefinitely without hitting context limits
- Cost: Some detail is lost in compression
- Frequency: My SaaS Platform session (1,070 turns) had 3 compression events
You can manually trigger compression with the /compact command when you notice context growing large.
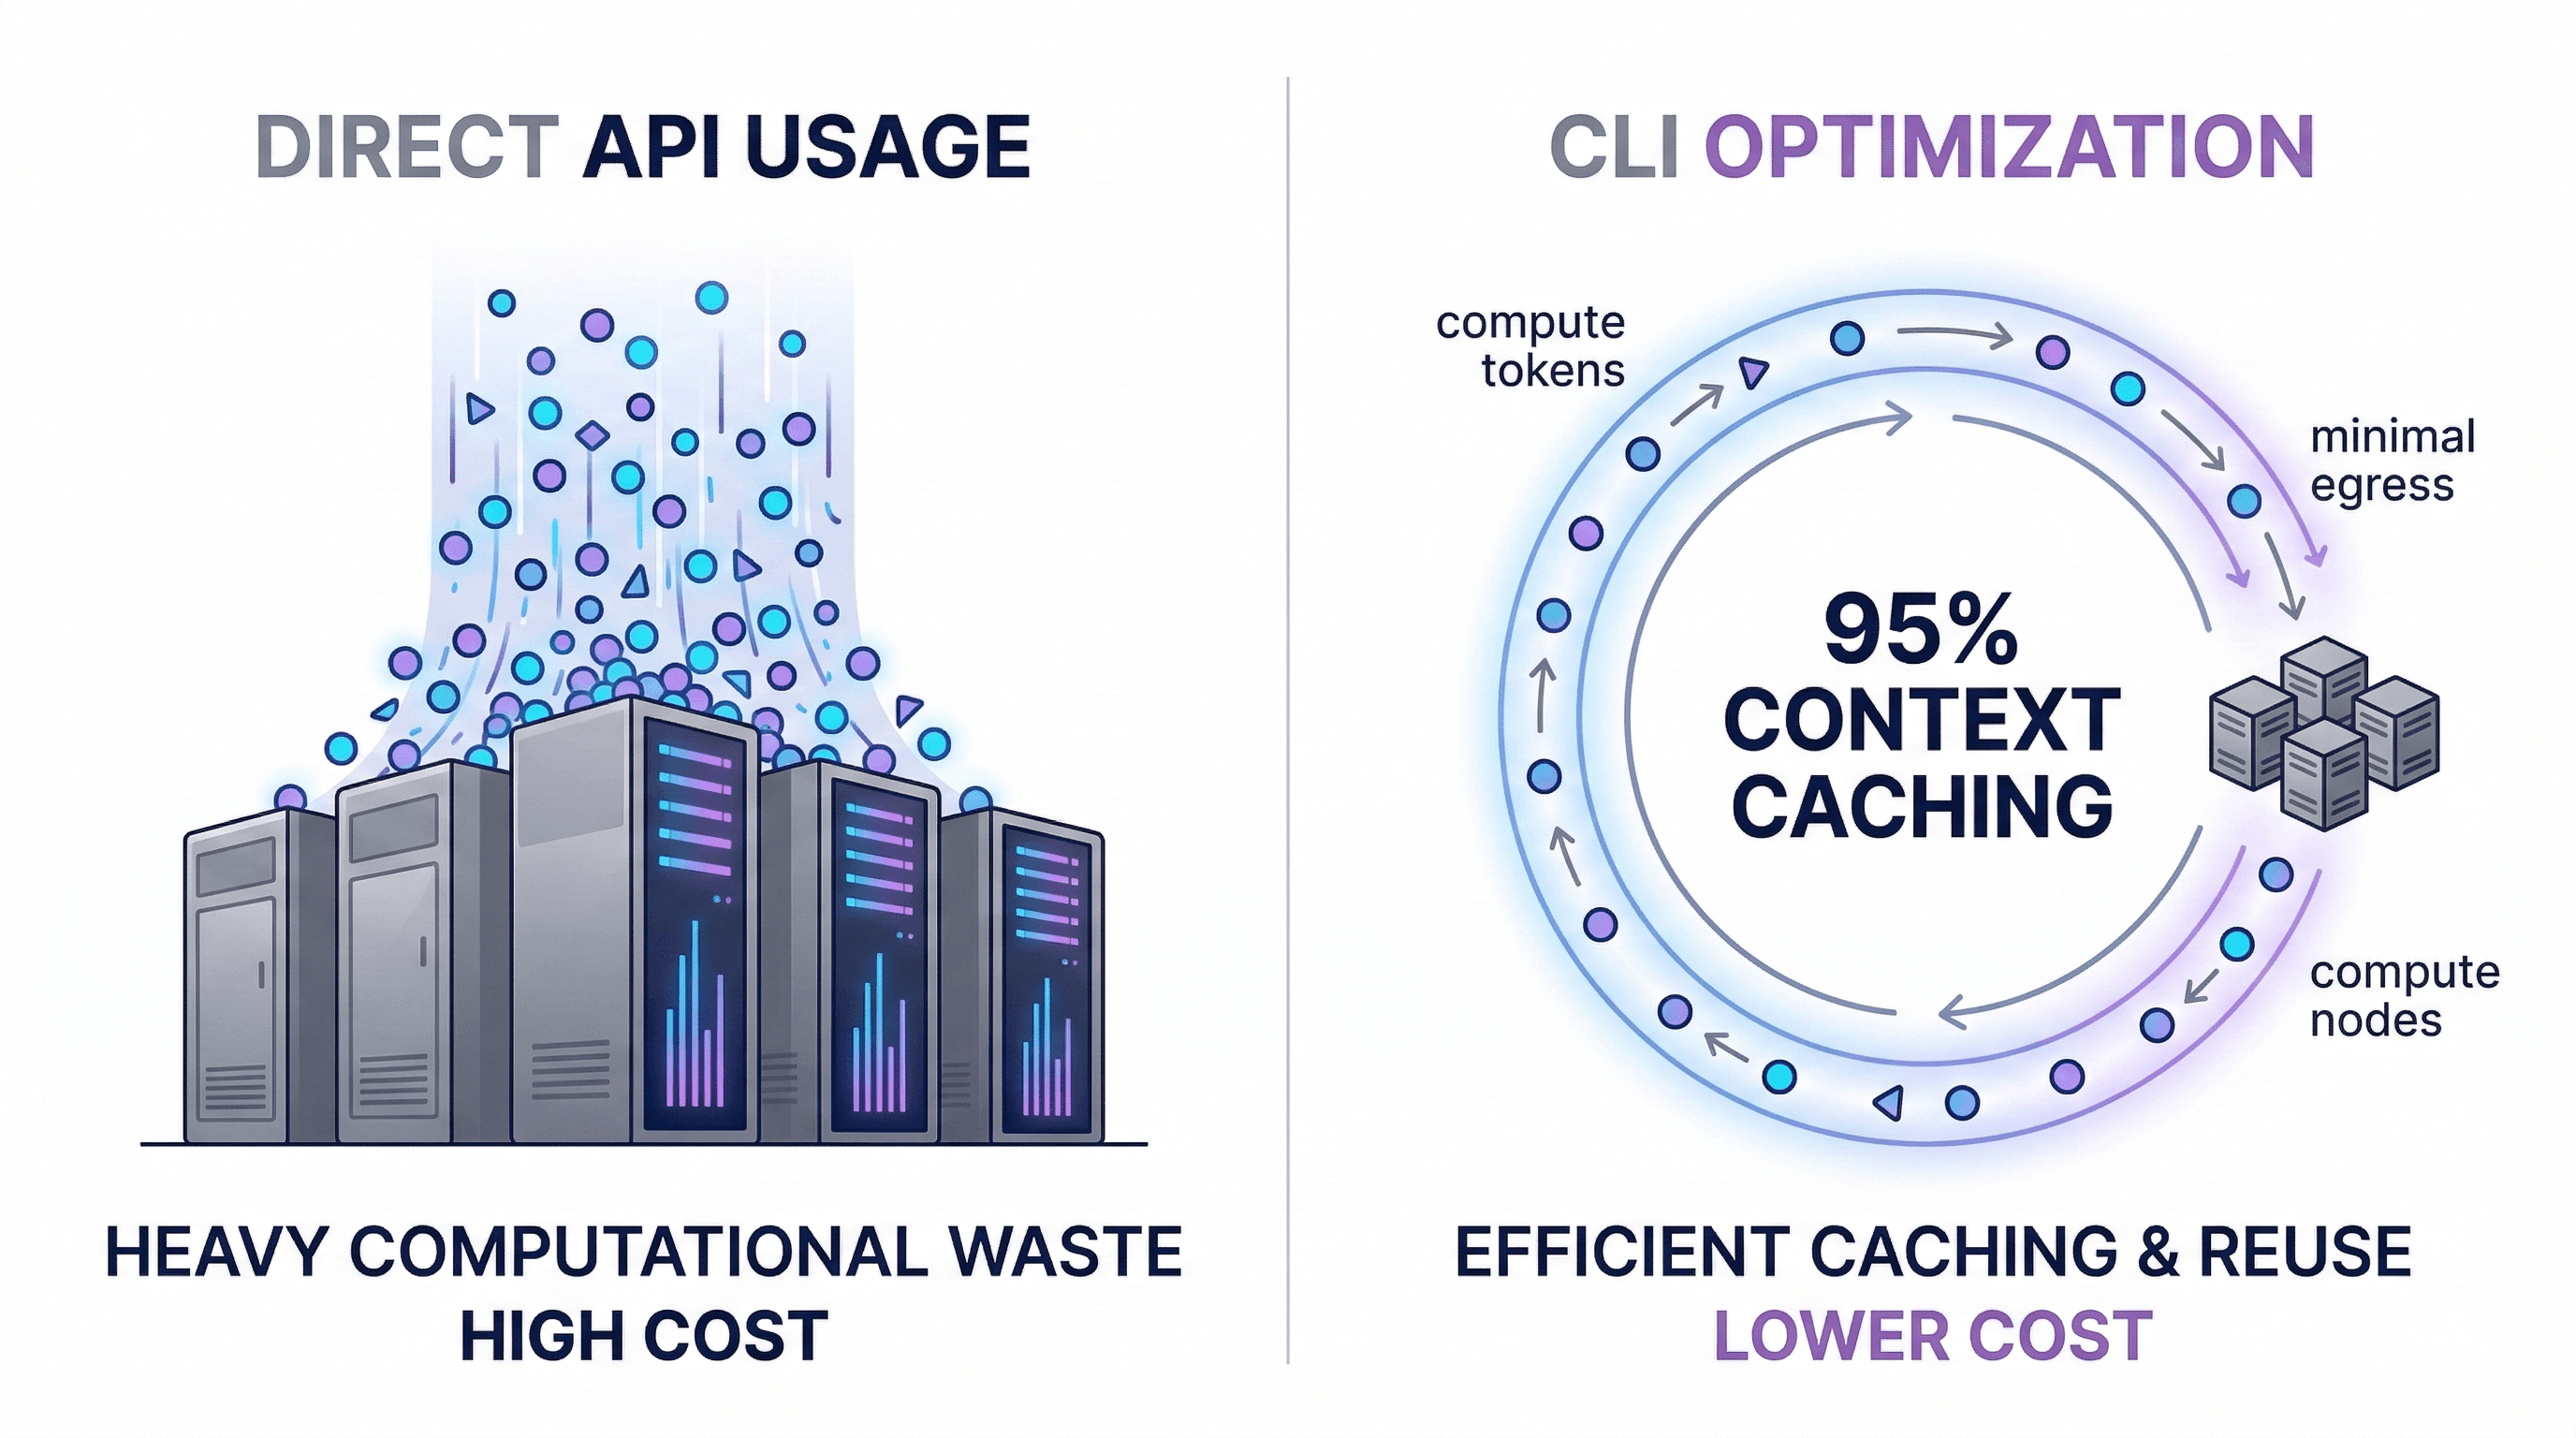
CLI vs API — Technical Cost Analysis
This is the question everyone asks: Why is the CLI so much cheaper than the same usage on the API?
Real Data Comparison (4 Days, 4 Projects)
| Project | API Cost (Pay-Per-Token) | CLI Cost |
|---|---|---|
| SaaS Platform | $80.44 | — |
| Backend API | $41.65 | — |
| Dev Tools | $42.39 | — |
| Chatbot Service | $5.76 | — |
| Total | $170.51 | Flat-rate (Pro/Max plan) |
Monthly projection at this usage rate: ~$1,280/month on API vs flat-rate pricing on CLI.
Per-Model Cost Breakdown (SaaS Platform, 2 Days)
| Model | Tokens | API Cost |
|---|---|---|
| Sonnet 4.6 | 78.5M | $31.43 |
| Opus 4.6 | 22.0M | $47.95 |
| Haiku 4.5 | 4.8M | $1.05 |
| Total | 105.3M | $80.44 |
The 5 Reasons CLI Is Cheaper
1. Automatic Prompt Caching
The CLI handles cache_control headers and prefix optimization automatically. Building this yourself means implementing cache-aware prompt assembly, managing cache TTLs, and optimizing prefix ordering. The CLI gets 97%+ cache hit rates out of the box.
2. Smart Model Routing
Haiku at $0.80/MTok for research tasks instead of Opus at $15/MTok for everything. The CLI dynamically routes to the cheapest model that can handle each sub-task.
3. Context Compression
Auto-compaction prevents context from growing unbounded. Without it, you'd hit the context limit and need to start a new session (losing all context) or pay for increasingly expensive API calls.
4. Subscription Economics
Humans type slower than API bots. Anthropic can offer flat-rate pricing because human typing speed creates a natural rate limit. A developer sending 50 messages/day with think time between them is predictable and bounded. An API script sending 50 requests/second is not.
5. Cache Reuse Within Sessions
Within a session, 97% of every API call is a cache read. The incremental cost of each additional message is tiny compared to the first message. This is why long sessions are surprisingly economical.
When API IS Better
The API is the right choice when you're:
- Building customer-facing products
- Need programmatic access at scale
- Running custom pipelines or batch processing
- Require fine-grained control over prompts and parameters
Design Patterns & Engineering Decisions
Stepping back, several design patterns emerge from this analysis:
| Pattern | Implementation | Why |
|---|---|---|
| Append-only log | JSONL files | Crash-safe, streamable, auditable |
| Security sandbox | CLI executes, AI proposes | No direct filesystem access for the model |
| Cache-first architecture | 1-hour ephemeral cache, prefix optimization | 9,000x compute reduction |
| Multi-model routing | Haiku/Sonnet/Opus per task type | 18x cost difference between cheapest and most expensive |
| Dedup by composite key | messageId:requestId hash | Handles parent/child session overlap |
| Context compression | Compact agents with Sonnet | Enables infinite-length sessions |
Practical Insights for Developers
Based on this analysis, here's what actually matters for your usage:
-
Don't fear long conversations within a session. Cache reads are 97% of tokens and cost 10% of input price. The incremental cost of message N+1 is small.
-
Be specific in prompts. Vague prompts cause more tool-use round-trips. "Fix the auth bug in
src/auth/login.tsline 42" = 2 API calls. "Something's wrong with login" = 6+ API calls. -
Use
/compactproactively. When you notice context growing large, manually trigger compression before the auto-trigger kicks in. You maintain more control over what gets preserved. -
Break big tasks into focused sessions. While long sessions are cheap, new sessions start with a fresh, small context — faster responses and more focused results.
-
Subagents are free optimization. When the CLI spawns Haiku agents for research, that's 18x cheaper than using the main Opus model. Don't fight it.
-
New sessions reset the cache. The first message in a new session is the most expensive (100% cache miss). Subsequent messages drop to 95%+ cache hits within 2-3 turns.
Engineering Takeaways
After analyzing 165.9 million tokens across 4 days of real usage, here's what I've concluded:
Claude Code is fundamentally a cache-optimized, multi-model orchestration layer. The CLI's value isn't the terminal UI — it's the invisible infrastructure that manages caching, model routing, context compression, and tool execution.
The 92% cost difference between API and CLI isn't a pricing trick. It's architectural. The CLI is purpose-built to exploit prefix caching (97% cache hits), multi-model routing (18x cost range), and human typing speed as a natural rate limiter.
The JSONL session format is a goldmine for anyone building custom tooling. Every API call, every token count, every model switch is recorded. If you want to build your own usage analytics, cost tracking, or session analysis — the data is sitting right there in your home directory.
Understanding these internals won't make you a better prompt engineer. But it will help you understand why certain patterns are cheap (long focused sessions), why others are expensive (starting fresh sessions frequently), and why Claude Code can offer flat-rate pricing that seems too good to be true.
It's not too good to be true. It's just good engineering.
All data in this post comes from real Claude Code sessions analyzed over 4 days across 4 active projects, totaling 165.9M tokens and $170.51 in equivalent API costs.