TL;DR
- A consumer app's iOS push delivery rate fell from the low 90s to below 60% over several weeks. Initial investigation focused on the notification delivery stack, including SDK-version and APNS-token hypotheses.
- We split the failure cohort by
customer_id. The failing cohort was almost entirely anonymous users who had never logged in. A large failure cohort with no identified customers is not normal customer behavior. - Cross-validation via AppsFlyer Protect360 showed 120k+ fraudulent install attributions in the same two-week window, spread across dozens of paid channels with near-total fraud concentration. Same shape, same date range, same anonymous-device pattern as the push failures.
- Real-customer push delivery on the upgraded build was ~99.99%. The published rate was being dragged down by anonymous install records that registered as reachable, never engaged, and inflated the failure count.
- The application-side SDK remediation had already resolved delivery behavior for legitimate users. The recommendation became "stop the install fraud upstream" plus "filter the suspicious anonymous cohort out of the published delivery KPI."
- When a downstream metric drifts, debug the cohort shape before debugging the downstream pipeline. Every push delivery failure looks identical at the wire; the question is who they were addressed to.
We were brought in to help debug an iOS push delivery problem. The client runs a high-traffic consumer app with paid acquisition across multiple ad networks. Their CRM sends millions of push notifications a month, and push is a meaningful revenue channel. When delivery rates fell by more than 30 percentage points over several weeks, it triggered a P0 incident.
Initial investigation focused on the notification delivery stack. SDK-version cohorts, APNS-token behavior, and credential/environment hypotheses were all reasonable places to look. The application team had already shipped an SDK-side remediation in their latest release, but the published delivery rate had not moved.
We came in expecting a notification SDK bug. We left with a different conclusion: the delivery metric was being polluted by a high-confidence install-fraud cohort, while delivery behavior for legitimate users was healthy.
The system path looked roughly like this:

The important point is that attribution fraud does not stop at marketing reports. Once a suspicious install opens the app and the SDK creates a CRM record, downstream systems treat that record like part of the reachable audience.
Where the data started
The CRM dashboard told this story for a recent campaign sent to iOS users:
- Total push attempts: ~25k
- Successful deliveries: ~15k
INVALID_REQUESTfailures: ~10k- Other failures: hundreds
- Reported delivery rate: high 50s
INVALID_REQUEST was the CRM vendor's normalized bucket for "APNS rejected this send request." Underneath that bucket, APNS can reject a push for specific reasons such as a bad device token, a token that does not match the app topic, a certificate/environment mismatch, or an unregistered token. The working theories cycled through environment mismatch, credential mismatch, and token invalidation.
The first thing we did was filter the campaign data to one specific cohort: users on the latest app version, with the latest SDK build. For that cohort, the numbers looked different:
- Successful deliveries: ~14.5k
INVALID_REQUESTfailures: 2INVALID_REQUESTrate: ~0.01%
The upgraded cohort showed near-zero delivery failures.
The ~10k failures dragging the published rate down were tagged with the previous SDK version. A reasonable hypothesis was that these were users who had not yet upgraded. The investigation then shifted from "how do we force the un-upgraded cohort to update?" to a simpler question.
What we considered first
Before splitting the failure cohort by customer_id, the working theories all sat inside the notification delivery stack:
- SDK-version regression. This was the cleanest signal in the early data and the theory we sat with longest. ~10k
INVALID_REQUESTfailures were tagged with the previous SDK version, and the upgraded cohort showed ~0.01% failure. The natural reading was that the un-upgraded build was broken and the open question was how to push those users to update. - APNS token invalidation. APNS can reject a push for a bad device token, a token that does not match the app topic, or an unregistered token. Token invalidation explains why an individual send fails. It does not explain why failures would cluster inside one identity cohort.
- Credential or environment mismatch. Certificate or environment drift produces APNS rejections that surface inside the same
INVALID_REQUESTbucket. Like token invalidation, this should not selectively land on anonymous users on a previous SDK build.
Each of these could plausibly produce the volume of INVALID_REQUEST events we were seeing. None of them predicted the cohort shape we eventually found, where every failure sat with a user who had never logged in.
We asked a different question: who are these users?
Why splitting by customer_id changed the case
The client's app uses a phone-OTP login flow. When a customer completes login, the CRM SDK sets identity attributes on the user record.
// Simplified: runs after OTP verification completes
async function onLoginSuccess(customer) {
  crm.user.login(customer.phone);
  crm.user.setEmail(customer.email);
  crm.user.setPhone(customer.phone);
  // customer_id is now set on the CRM user record.
  // Anonymous installs that never reach this code path
  // remain unidentified for their entire lifecycle.
}
Anonymous installs (devices that opened the app but never completed OTP) never hit this code path. They live in the CRM as anonymous user records with no customer_id.
We added customer_id as a split dimension on the failure cohort. The result:
- Failures with
customer_idset: 0 - Failures without
customer_id: ~9.5k
None of the failing users in that cohort had ever logged in. For comparison, the successful-delivery cohort over the same period was the opposite shape: nearly every successful delivery went to a phone-ID user.
Anonymous users are not inherently fraudulent. Plenty of legitimate users install an app, browse, and never complete login. But a failure cohort of this size with zero downstream identity, no meaningful engagement, and a matching attribution-fraud pattern is statistically inconsistent with normal acquisition traffic.
The cohort behavior was highly consistent with install-fraud traffic rather than legitimate-user acquisition. These were real or virtual iOS devices that the app SDK had registered as reachable, but that had never engaged with the app long enough to complete signup. Push delivery failure rates for this cohort were disproportionately high at the APNS/vendor layer. The failures were counted in the same KPI as real-customer failures, and the published metric collapsed.
How install fraud breaks downstream metrics
Mobile attribution works on a last-click model. When a user clicks an ad, the ad network sends a click event to AppsFlyer (or Adjust, Branch, Singular) with the device identifier. When the user later installs the app, the attribution platform matches the install to the most recent click on that device and attributes the install to that ad network. The ad network gets paid.
Simplified, the model looks like this:
const ATTRIBUTION_WINDOW_DAYS = 7;

function attributeInstall(deviceId: string): string {
  const recentClick = findMostRecentClick(
    deviceId,
    ATTRIBUTION_WINDOW_DAYS,
  );
  return recentClick ? recentClick.mediaSource : 'organic';
}
This model has a known weakness called Click Flood. A fraudulent network fires fake click events against a large pool of device identifiers it has harvested somewhere. It does not know which device will actually install the app. But statistically, some will, for any reason at all: organic discovery, a different paid channel, a friend's recommendation. When the install fires, the fraudster's click was the most recent one on file, so the fraudster wins the attribution.
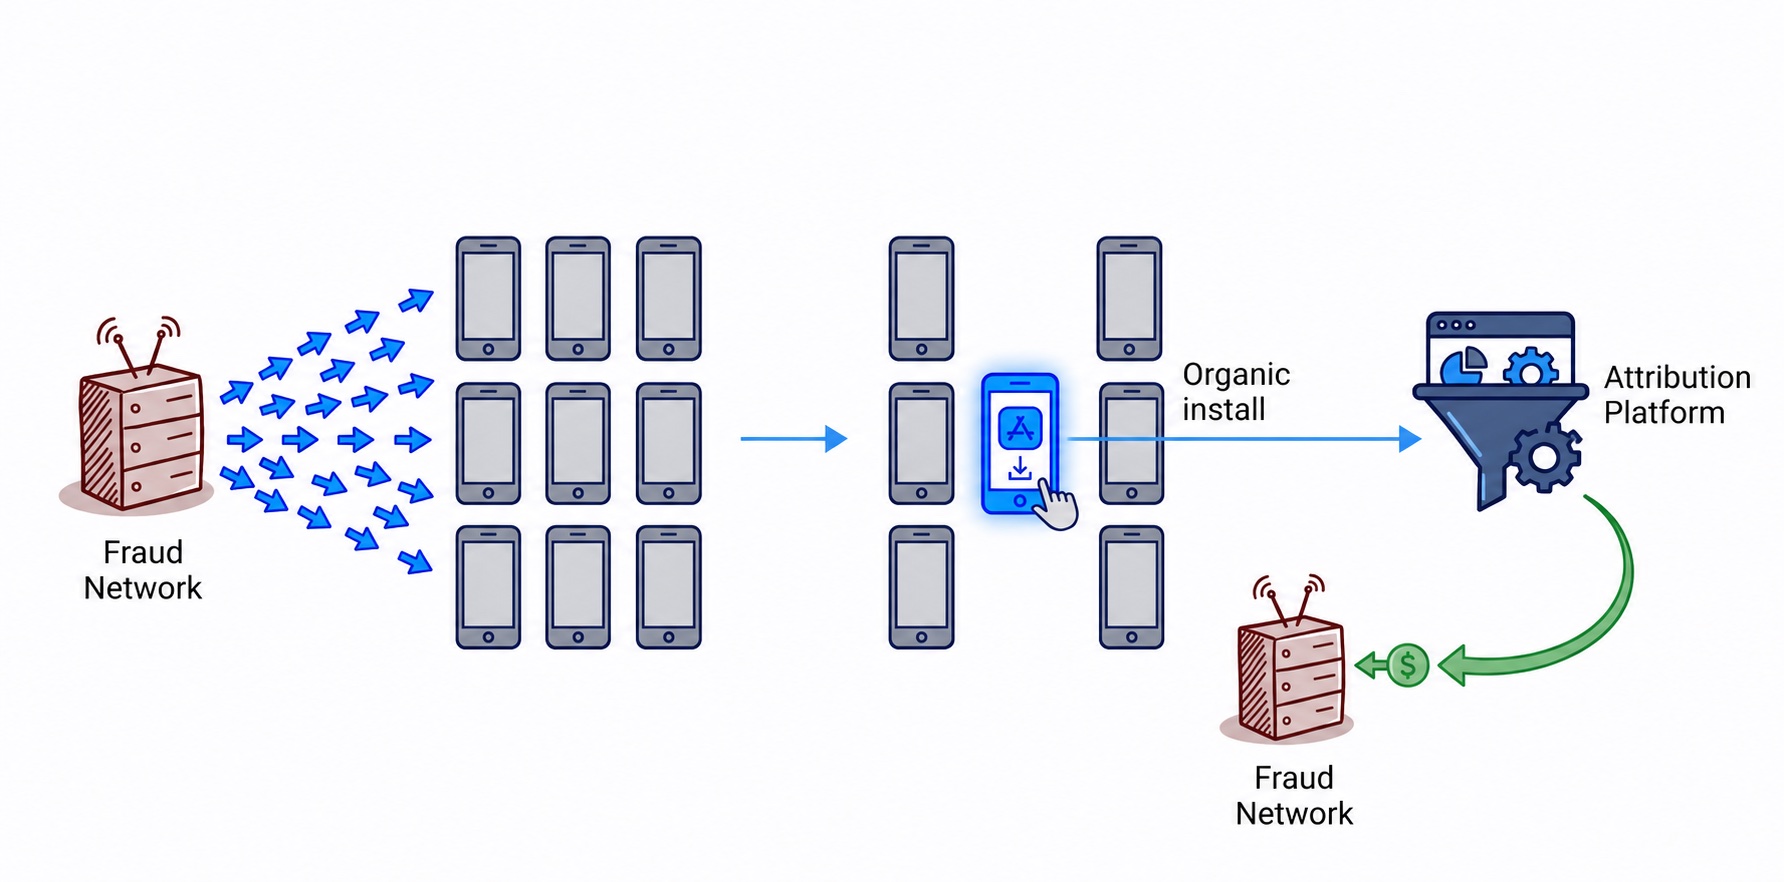
The real cost is not just the CPI payout. The install itself runs on a real device or a virtual environment realistic enough to fool the SDK. The app SDK fires app_installed, registers a push token with the CRM, sets default user attributes. From the CRM's perspective, a new user appeared. The CRM now has someone to push to.
Then the suspicious device does nothing. No login, no product views, no engagement. The device record sits in the CRM's reachable-user table. Every push the CRM sends to that record fails at the APNS/vendor layer. The push failure counts against the CRM's published delivery rate, even though no real customer was affected.
We could not conclusively determine the exact APNS rejection subtype because the CRM normalized multiple APNS responses into a single INVALID_REQUEST bucket. The likely explanations were stale tokens, environment mismatch, topic mismatch, or unregistered tokens. But the important observation was that the failures clustered entirely inside an anonymous, non-engaged install cohort.
At scale, this looks exactly like what we saw: a healthy reachable-user count, a healthy push send count, a collapsing delivery rate, and zero customer complaints.
Cross-validating with AppsFlyer Protect360
AppsFlyer's fraud detection module (Protect360) classifies installs as legitimate or fraudulent based on click-to-install-time distributions, IP intelligence, device fingerprint anomalies, and post-install behavioral patterns. It is independent of any CRM. If our cohort-split theory was right, Protect360 should show a similar fraud pattern hitting the app over the same period.
Fraud-classification systems are probabilistic rather than absolute, but the overlap between attribution-fraud patterns, anonymous-device concentration, and downstream engagement absence created a high-confidence signal.
Pulling the Protect360 report for the same two-week window:
- Total fraudulent install attributions: 120k+
- Real-time blocked: 20k+
- Post-attribution flagged: 100k+
- Fraud reason mix: roughly half Click Flood, roughly one-third Bots, with the rest split across behavioral anomalies, install hijacking, and CTIT anomalies
120k+ fraud installs over two weeks. The shape matched the CRM-side anonymous cohort: a steady daily stream of installs that fired the SDK once and then went silent.
The channel-level breakdown was the striking part. Branded paid channels showed essentially no fraud. Organic showed low single-digit fraud. But the long tail of small affiliate networks, all named with the same pseudo-random pattern, showed near-total fraud concentration per channel. Dozens of channels each contributed low-thousands of fraudulent installs over the two-week window.
That pattern is structural. It is unlikely to be dozens of unrelated ad networks each having an identical fraud problem at the same time. A more plausible explanation is one fraud operation running a portfolio of pseudo-network names through one or two upstream aggregators. The pseudo-random naming dilutes volume across many sub-publishers so no single channel hits the threshold for human-eyeball scrutiny.
What we actually recommended
The application-side SDK remediation had already resolved delivery behavior for legitimate users. We did not need to rewrite the notification SDK integration. The recommendations were operational:
One configuration change in Protect360. Re-engagement Hijacking detection was set to "Tagged", meaning detected but allowed to pass through as a valid attribution. We recommended switching to "Implemented", which detects and blocks at attribution time. Across the same period, 10k+ hijacked re-engagement events had been logged but credited to suspicious sources. If contracts paid out on re-engagement events, this was direct revenue leakage.
Filter the anonymous cohort from the published delivery KPI. This is a CRM-side reporting ask. Push delivery rate is calculated against the full reachable-user table by default. Filtering the metric to users with an identified customer_id gives a true measure of customer reachability. The standard delivery KPI conflates reachable customers with merely existing device records, and the suspicious cohort sits squarely in that gap.
Pause the dozens of channels with near-total fraud concentration. Low downside based on Protect360's own classification, with the final call sitting with the paid-UA owner. The savings are operational: cleaner analytics, less bot pollution, and fewer false investigations across CRM, mobile, and growth teams.
Identify the upstream aggregator. Dozens of pseudo-networks with the same naming pattern usually do not get onboarded individually. They often come through one DSP or affiliate platform that resells sub-publisher inventory. That platform is the actual partner relationship to address.
The larger cost was operational: debugging effort across CRM, mobile, vendor support, and growth teams; polluted CRM metrics; distorted attribution data; and avoidable escalation on a delivery system that was healthy for legitimate users.
The technical thread closed once these recommendations reached the right teams. The published delivery rate was not immediately back to its previous level because that depended on the suspicious cohort aging out of the CRM's reachable-user table, but real-customer reachability, the number that actually matters, was ~99.99% on the new build.
This was not a failure of APNS, the CRM platform, or the attribution provider individually. The issue emerged from how fraudulent acquisition traffic propagated through otherwise functioning downstream systems.
Quick diagnostic checklist
When a downstream delivery metric drifts, run this check before rewriting the pipeline:
- Split failures by identified vs anonymous users.
- Compare failure cohorts across app versions and SDK versions.
- Cross-reference attribution-fraud tooling for the same period.
- Validate post-install engagement depth: login, product views, cart events, or any app-specific intent signal.
- Check channel-level fraud concentration instead of only aggregate fraud rate.
- Compare reported KPI degradation with customer complaints, revenue impact, and real-user engagement.
What we got wrong
We spent too long on SDK-level hypotheses before splitting the cohort by customer_id. The data was always in the CRM. The dimension was one dropdown away. We did not look at it early enough because the problem framing, "push delivery is broken", pointed us at the push system.
The lesson: when a metric drifts, debug the cohort shape before debugging the pipeline. The CRM's INVALID_REQUEST events all looked identical at the protocol level. The useful difference was not in the push request, response, token, timestamp, or SDK version. It was in who the push was addressed to. And "who" lived in the user attribute table, not the event log.
We have started applying this pattern in other investigations. Fraud, bot traffic, sudden organic spikes, and attribution shifts all change the cohort before they change the metric.
Mobile attribution fraud also has second-order effects on every downstream system the app SDK touches. CRM, product analytics, A/B testing, recommendation engines: all of them ingest data from devices that the attribution layer has classified as fraudulent. Even if Protect360 or an equivalent tool blocks attribution credit at the financial layer, downstream systems may still see the devices.
We did not solve install fraud in this engagement. That work belongs with the paid-UA team and aggregator partner. What we did was separate "the push notification SDK is broken" from "the input population to the push notification SDK has been polluted." Different problems, different owners, different fixes.
If you are debugging a CRM delivery rate, a Mixpanel funnel, or any other downstream metric on a paid-UA app and the numbers do not match real customer outcomes, run the cohort-shape check first. It is one dropdown.